Many MSP reports are data-heavy but decision-light. Clients get charts, but no clear signal on whether service reliability is improving.
If you want stronger renewals and cleaner QBRs, your SLA report should answer three questions clearly:
- Are critical services meeting contracted reliability targets?
- Are incidents being resolved faster over time?
- Is communication quality improving during outages?
Why Typical SLA Reports Fall Short
Common report problems include:
- Averaging away risk: One global uptime number hides critical component failures.
- No operational context: Clients see downtime minutes but not response quality or trend direction.
- Too many vanity charts: Lots of graphs, no clear action owner.
- Weak communication metrics: Incident transparency is rarely measured, even though clients feel it immediately.
A stronger report links technical reliability to business confidence.
QBR Scorecard: 5 Metrics That Matter
Use one page per client with these metrics first:
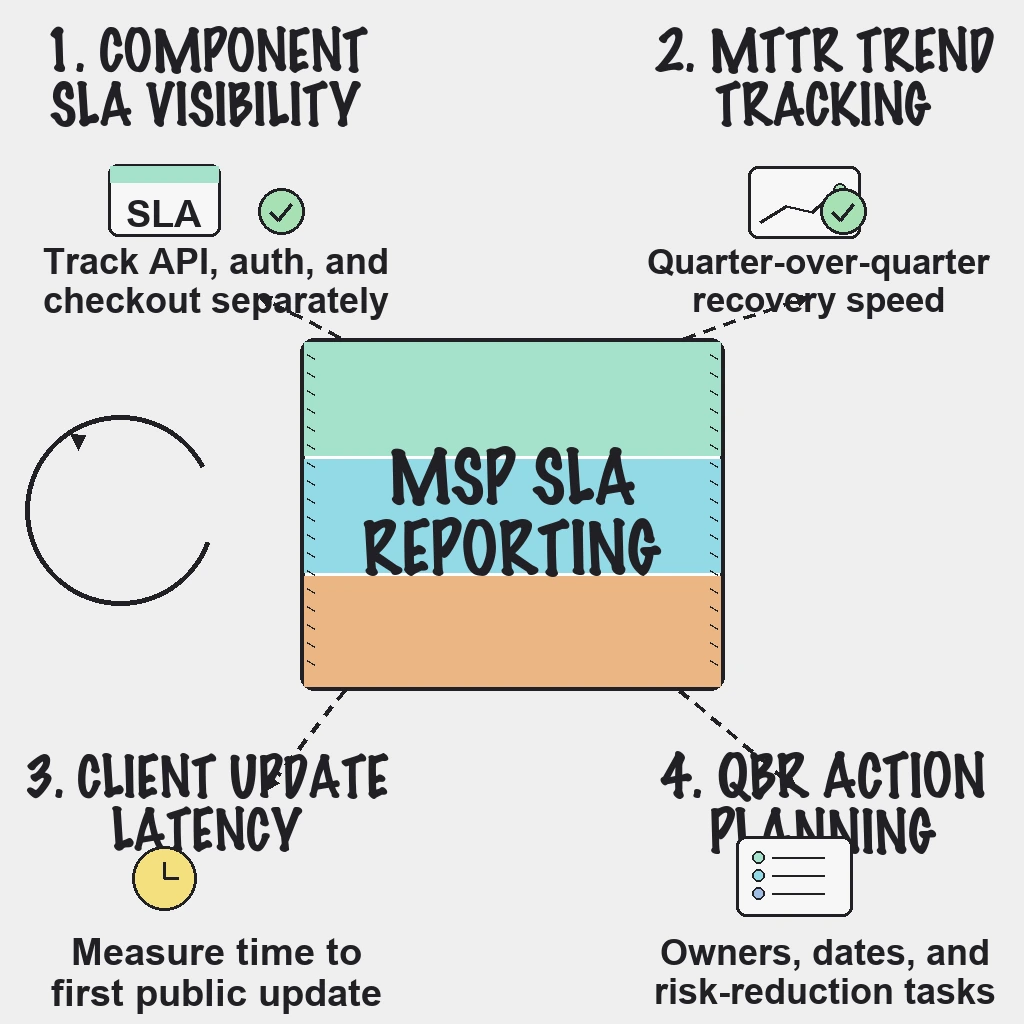
- SLA attainment by critical component: Report uptime separately for API, auth, checkout, dashboard, and integrations.
- MTTR (mean time to restore): Show current quarter vs previous quarter trend.
- False-positive alert rate: High noise means slower real incident response and higher on-call fatigue.
- Time to first client update: Measures incident communication speed and trust readiness.
- Repeat incident rate: Tracks whether root-cause fixes are preventing recurrence.
If you can only show five metrics, these create the best executive signal.
Recommended Report Structure
Section 1: Reliability Outcome Summary
- SLA status: met / at risk / missed
- Services with highest incident impact
- Quarter-over-quarter reliability trend
Section 2: Incident Operations Quality
- MTTA and MTTR trend
- Top incident themes by cause
- False-positive reduction progress
Section 3: Communication Performance
- First update latency during incidents
- Update cadence adherence
- Client-facing post-incident summaries delivered on time
Section 4: Next-Quarter Reliability Plan
- Top three risk-reduction actions
- Owner and target date for each action
- Contract or scope implications (if any)
This keeps QBR discussions focused on accountability and forward movement.
Reader Questions, Answered
What is the most important metric in an MSP SLA report?
Uptime by critical component, not a single blended number. Clients care most about the services tied directly to revenue and operations.
Should MSPs include communication metrics in QBRs?
Yes. Communication speed and consistency directly affect client trust during incidents and should be treated as a measurable service quality dimension.
How often should SLA reports be reviewed with clients?
Monthly operational reviews plus quarterly business reviews is a practical baseline for most MSP portfolios.
Wrap Up
Great SLA reporting is not about longer dashboards. It is about making reliability quality obvious, measurable, and improvable for each client.
Ready to build QBR-ready uptime reporting with cleaner alerts and faster incident workflows?
Start your free trial on PingAlert
Related guides:
- Client reporting for agencies
- Agency incident response playbook
- MSP uptime monitoring playbook
- How synthetic monitoring helps
- Status page best practices for customer trust